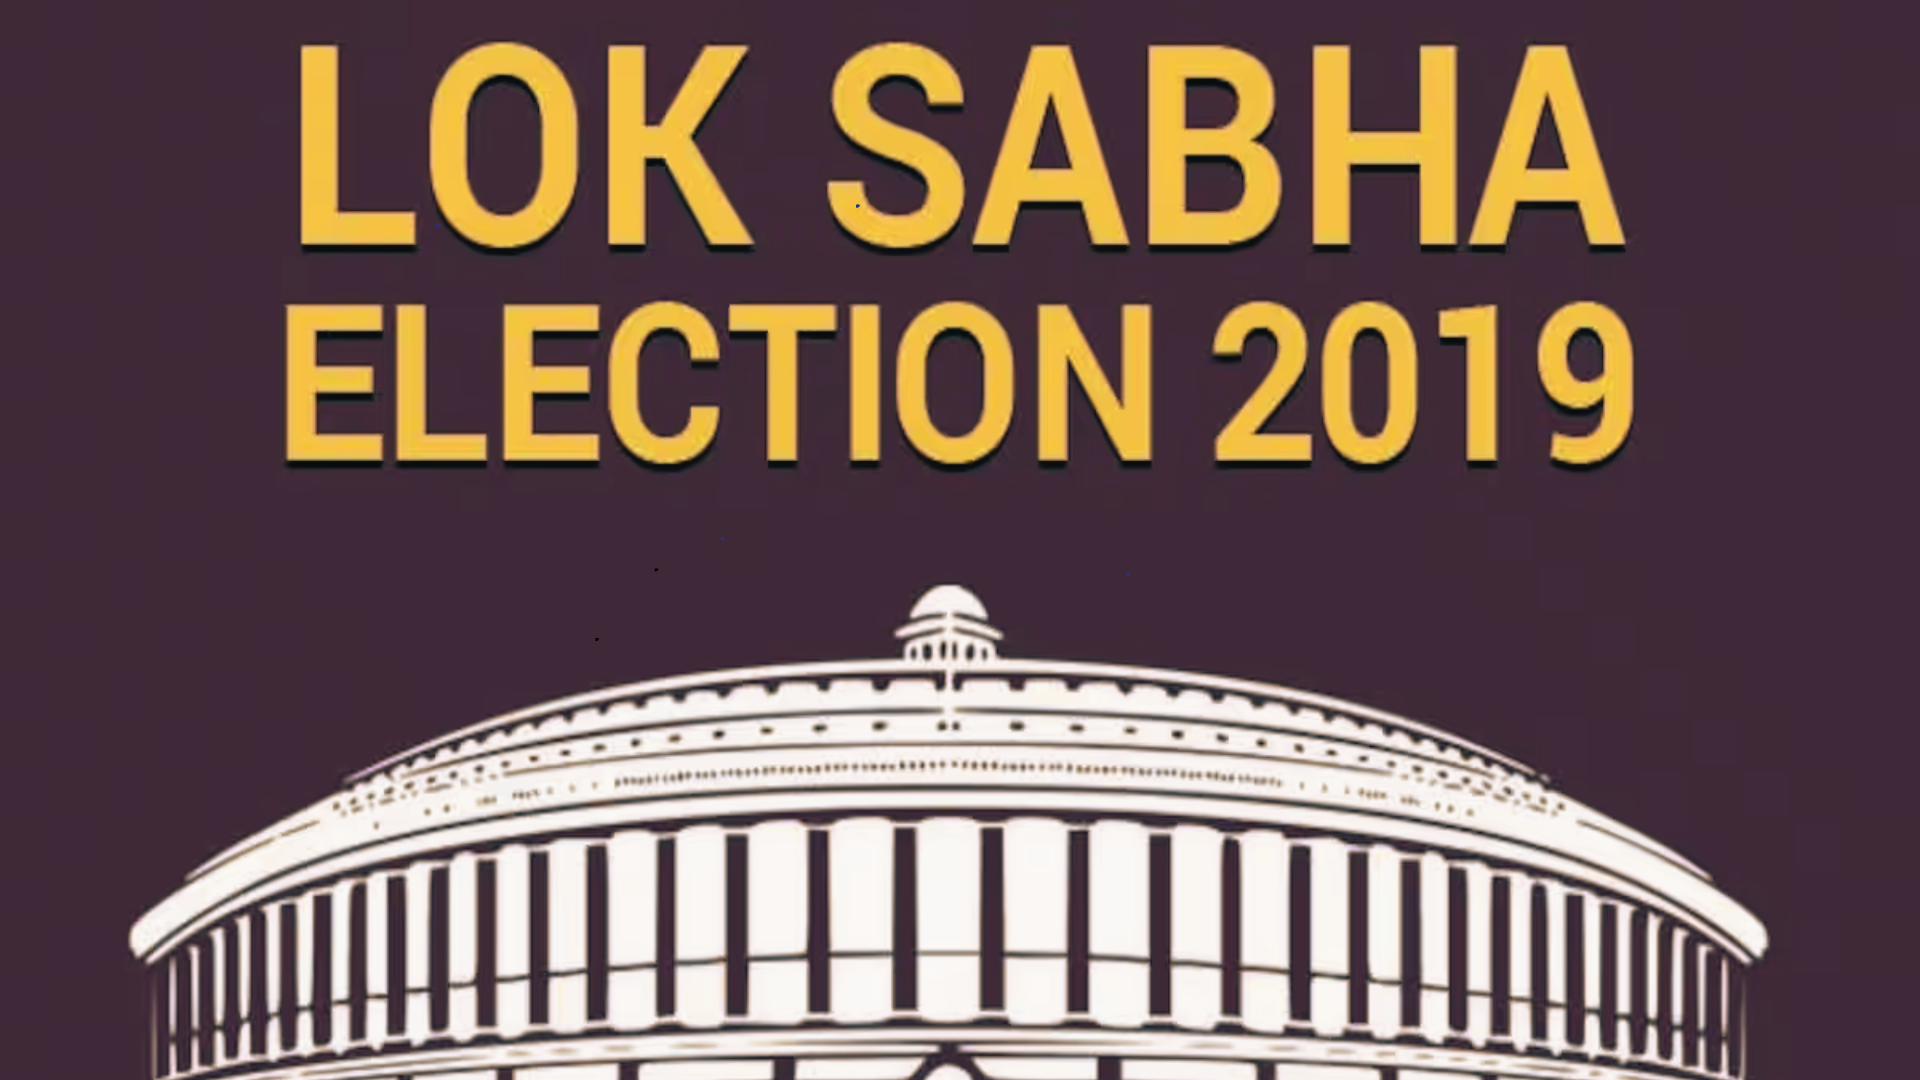
Recap Lok Sabha Elections 2019: Unveiling Key Election Statistics and Insights
Recap Lok Sabha Elections 2019: Unveiling Key Election Statistics and Insights
In a matter of weeks, India is gearing up for the celebration of Democracy with the Lok Sabha Election 2024. But before moving forward, let’s reflect on the 2019 Lok Sabha Elections. ……………
In a few weeks, India is all set to commemorate Democracy with the Lok Sabha Election 2024. However, before looking ahead, let’s take a moment to review the 2019 Lok Sabha Elections.
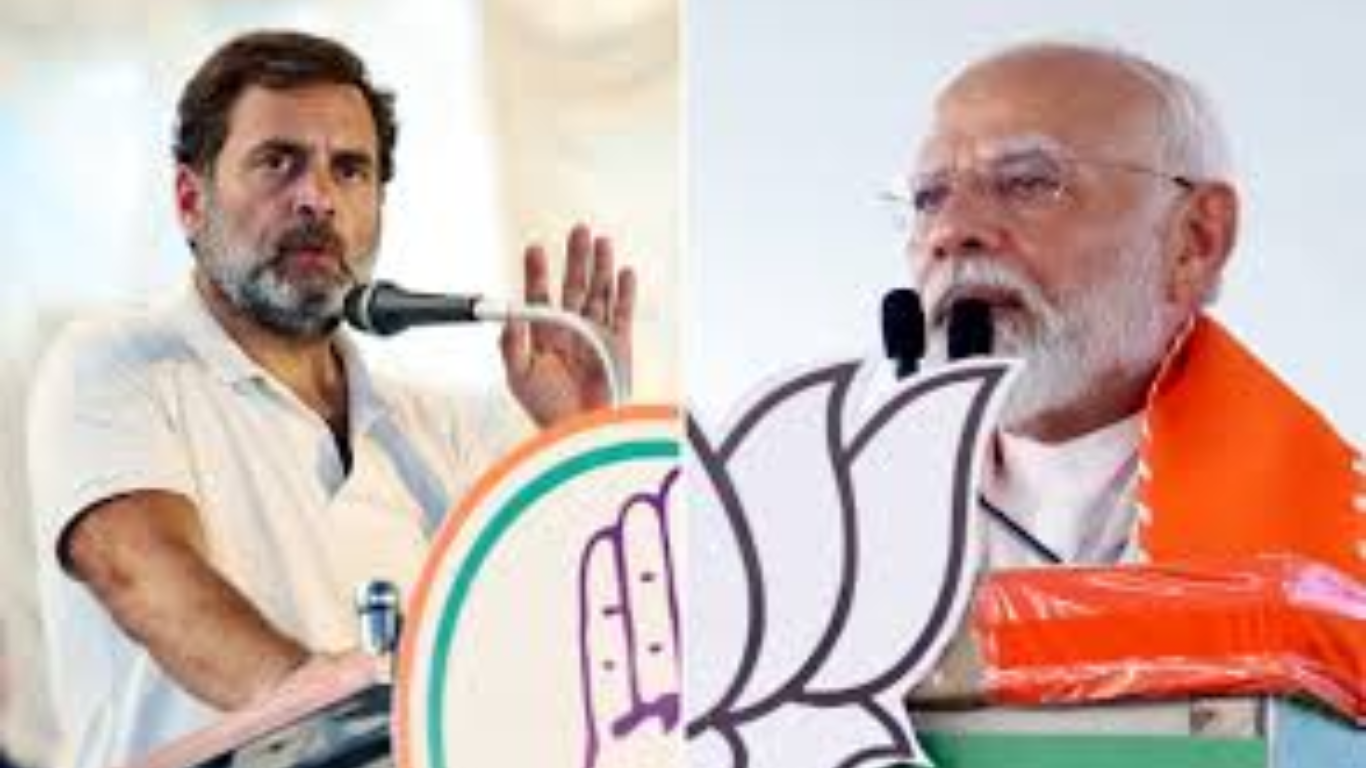
The 2019 Lok Sabha Election signified Narendra Modi’s second term as Prime Minister. Conducted in seven phases spanning from April 11 to May 19, 2019, across India, it engaged approximately 900 million eligible voters. The election saw robust campaigning from various political parties, alliances, and independent candidates vying for seats in the 17th Lok Sabha.
The Bharatiya Janata Party (BJP)-led National Democratic Alliance (NDA) and the Indian National Congress (INC)-led United Progressive Alliance (UPA) were the primary contenders, with regional parties and independent candidates also playing crucial roles in many states.
However, here are the statistics of the 2019 Lok Sabha Elections:
No. of Phases: The 2019 Lok Sabha Elections were held in 7 phases starting from April 11th to March 19th.
No. of Voters and No. of Vote %: In the 2019 Lok Sabha elections, there were a total of 6,14,684,398 voters and the no. of vote percentage was 67.40%.
Wondering about the count of the 1st time voters in the last Lok Sabha Elections?
In the 2019 Lok Sabha Elections, the number was 1.5 crore, but this year in 2024 the first time voters are 1.85 crore.
Political Party Seat Share: The National Democratic Alliance (NDA), led by the BJP, secured victory in 303 seats. Whereas the opponent Indian National Congress landed with 52 seats, followed by Bengal’s TMC landing with securing 22 seats followed by the DMK party securing 24 seats. The stats below covers the other parties as well:
Party Vote Share: It refers to the percentage of total votes received by a political party in an election. It is calculated by dividing the total number of votes received by a party by the total number of valid votes cast in the election and then multiplying the result by 100 to get the percentage. Party vote share is an important metric used to analyze the performance of political parties in elections and to understand their level of support among voters.